What Urban Planners Need to Know About Micro-Mobility Infrastructure
Cities are changing faster than most planning departments can keep up with. E-scooters appeared on streets almost overnight, bike sharing programs multiplied, and suddenly everyone’s talking about micromobility infrastructure planning. If you’re a planner trying to retrofit 20th-century streets for 21st-century transportation, you know the challenge is real.
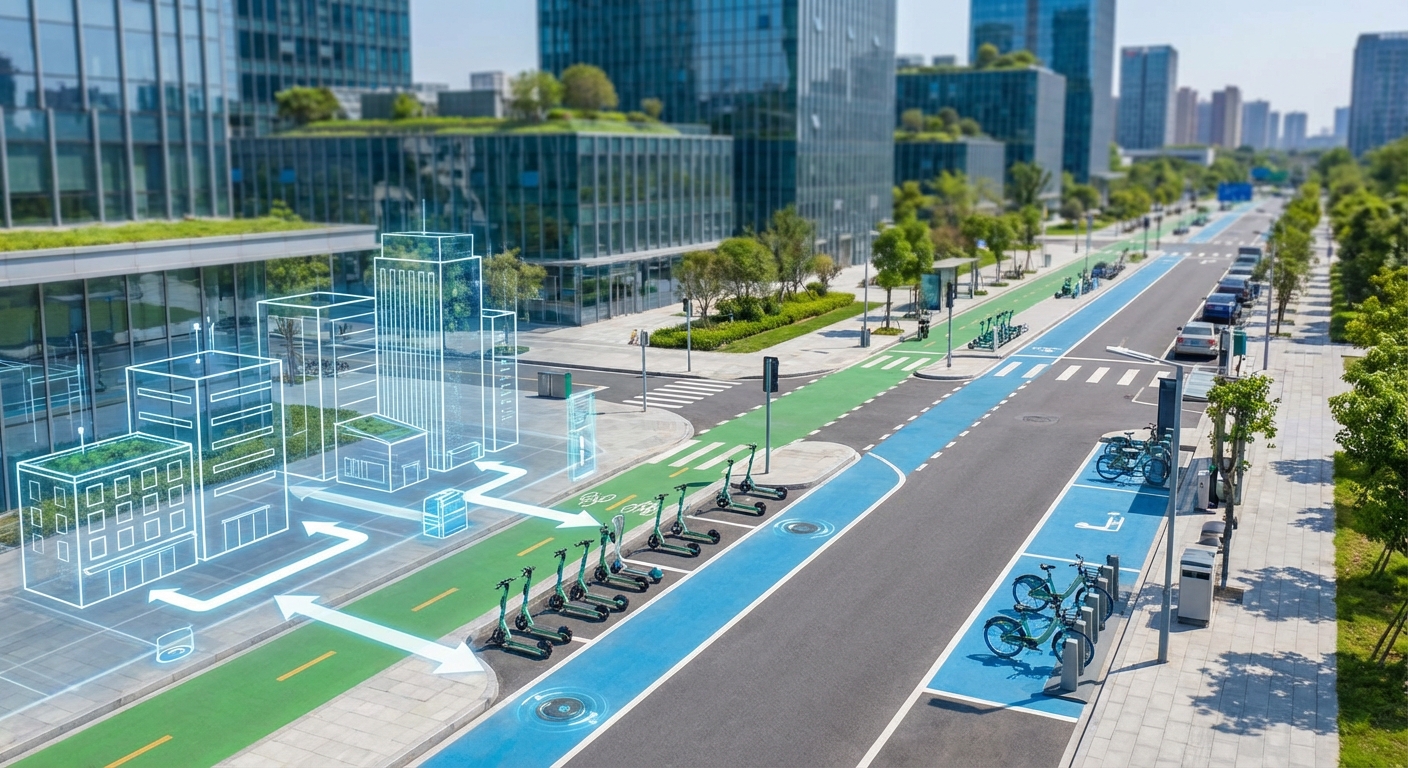
Successful micromobility infrastructure planning requires dedicated lane networks, proper charging stations, clear parking zones, and integration with existing transit. Cities that prioritize safety buffers, weather protection, and data-driven adjustments see 40% higher adoption rates and fewer conflicts between riders, pedestrians, and vehicles. Start with pilot corridors before scaling citywide.
Understanding what micromobility actually means for your city
Micromobility isn’t just e-scooters and bikes. It includes electric skateboards, shared bikes, personal mobility devices, and anything else that moves people short distances without a car.
The average micromobility trip covers 2.5 miles. That’s the distance most people drive but could easily ride. Your infrastructure needs to make that ride safer and more convenient than grabbing car keys.
Most cities make the mistake of treating micromobility as an afterthought. They paint a few bike lanes and call it done. Real infrastructure planning means rethinking how street space gets allocated.
Protected lanes matter more than painted lines. A study of 12 major cities found that protected infrastructure increased ridership by 75% compared to shared roadways. People won’t ride if they feel unsafe.
Building the foundation with dedicated lane networks
Start by mapping your city’s transportation patterns. Where do people actually need to go? Schools, transit stations, commercial districts, and residential neighborhoods need connections.
Your lane network should follow these principles:
- Create continuous routes that don’t randomly end at intersections
- Connect major destinations without forcing riders onto high-speed roads
- Provide alternatives to congested car routes
- Link with public transit hubs for last-mile transportation solutions
Protected bike lanes need physical separation. Concrete barriers, planters, or parked cars between riders and traffic reduce accidents by 90% compared to painted lanes.
Width matters too. A single lane needs minimum 5 feet. Two-way traffic requires 10 feet. Add another 3 feet buffer from car traffic.
Surface quality affects adoption rates dramatically. Smooth pavement without potholes, cracks, or drainage grates makes the difference between someone choosing to ride or drive.
Designing infrastructure that works in real weather
Your city probably has rain. Maybe snow. Definitely heat or cold depending on season.
Covered bike lanes sound expensive, but cities like Copenhagen prove they increase year-round ridership by 60%. Even partial coverage at major stops helps.
Drainage systems need special attention. Water pooling in bike lanes forces riders into car traffic. Slightly crowned surfaces and proper grates solve this.
Winter maintenance can’t be an afterthought. If you plow car lanes but ignore bike infrastructure, you’re telling riders their safety doesn’t matter. Cities that prioritize micromobility route clearing maintain 80% of summer ridership through winter.
“We learned the hard way that infrastructure unused in bad weather is infrastructure that won’t get funded long-term. Build for your worst weather day, not your best.” — Transportation Director, Portland
Heat considerations matter in warmer climates. Shade trees, covered waiting areas, and light-colored paving reduce surface temperatures by 15-20 degrees.
Setting up charging and parking infrastructure
Electric vehicles need power. Seems obvious, but many cities forget this until scooters die mid-trip and clutter sidewalks.
Charging stations should appear every half mile in high-traffic areas. Solar-powered options reduce grid impact and operating costs.
Parking zones need clear marking and enforcement. Geofenced digital parking works better than painted boxes because riders get real-time guidance through apps that make e-scooters safer.
Consider these parking location priorities:
- Transit station entrances and exits
- Commercial district corners with high foot traffic
- Residential neighborhood edges near main roads
- University and school campus boundaries
- Employment center perimeters
Vertical bike racks save 60% more space than traditional designs. Two-tier systems work in dense areas but need proper training signage.
Secure parking increases adoption. Covered, monitored bike parking at transit stations can triple bike-to-train commuting rates.
Integrating micromobility with existing transit systems
The best infrastructure doesn’t compete with buses and trains. It feeds them.
Plan micromobility hubs at every major transit stop. These should include:
- Secure bike parking with 24-hour access
- Shared scooter parking zones
- Real-time transit information displays
- Weather protection
- Bike repair stations with basic tools
Timing matters too. If the last mile from the train station takes 20 minutes on foot but 5 minutes on a scooter, you’ve just made transit viable for thousands more people.
Fare integration helps adoption. Cities that allow single-payment systems across transit and micromobility see 35% higher usage of both.
Consider allowing bikes and scooters on transit during off-peak hours. This extends the range of micromobility beyond the lane network.
Managing conflicts between different road users
Pedestrians, cyclists, scooter riders, and drivers all want space. Your job is allocating it fairly.
Separate pedestrian and riding zones completely. Mixed-use paths create accidents and resentment. Even a painted line helps, but physical separation works better.
Intersection design causes most conflicts. Protected intersections with separate signal phases reduce micromobility accidents by 70%.
Speed limits need enforcement. Most cities set 15 mph limits in mixed areas, 20 mph in protected lanes. Geofencing technology can automatically slow vehicles in pedestrian zones.
| Infrastructure Type | Accident Rate | User Satisfaction | Implementation Cost |
|---|---|---|---|
| Painted bike lanes | High (8.2 per 100k trips) | Low (42%) | Low ($50k per mile) |
| Protected lanes | Low (1.1 per 100k trips) | High (89%) | Medium ($400k per mile) |
| Separated paths | Very Low (0.3 per 100k trips) | Very High (94%) | High ($1.2M per mile) |
| Shared roadways | Very High (15.7 per 100k trips) | Very Low (18%) | None |
Education campaigns reduce conflicts more than enforcement alone. Clear signage explaining right-of-way rules helps everyone understand expectations.
Planning for growth and future technology
Today’s infrastructure needs to work for tomorrow’s devices. Ten years ago, nobody planned for e-scooters. What comes next?
Build wider than current demand suggests. A network that feels empty at launch will fill within two years if designed well. Undersized infrastructure forces expensive retrofits.
Modular design allows adaptation. Movable barriers, adjustable lane widths, and flexible parking zones let you respond to changing usage patterns.
Data collection should be built into infrastructure from day one. Sensors tracking volume, speed, and usage patterns inform future decisions. Cities using real-time data adjust infrastructure 3x faster than those relying on annual surveys.
Charging infrastructure should support higher voltages than current devices need. Battery technology improves constantly, and faster charging will become standard.
Consider autonomous micromobility devices. Several cities are testing self-driving delivery bots and mobility devices. Your infrastructure might need to accommodate them soon.
Addressing common planning mistakes before they happen
Most cities repeat the same errors. Learn from their experience.
Mistake 1: Starting too small. A single bike lane doesn’t create a network. It creates a dangerous dead end. Launch with connected corridors that actually get people where they need to go.
Mistake 2: Ignoring maintenance budgets. Infrastructure that deteriorates quickly loses users permanently. Budget 15% of construction costs annually for maintenance.
Mistake 3: Skipping community input. Residents know which routes they’d actually use. Planners who skip consultation build infrastructure nobody rides.
Mistake 4: Treating all neighborhoods equally. High-density areas need different solutions than suburbs. One-size-fits-all approaches waste money and frustrate everyone.
Mistake 5: Forgetting about safety gear and education. Infrastructure alone doesn’t create safe riders. Pair physical improvements with rider education programs.
Funding strategies that actually work
Infrastructure costs money. Lots of it. But creative funding makes projects possible.
Federal transportation grants increasingly include micromobility. The Infrastructure Investment and Jobs Act allocated $1.2 billion for active transportation projects through 2026.
Public-private partnerships with scooter companies can offset costs. Many operators will fund infrastructure improvements in exchange for operating permits.
Parking revenue reallocation works in dense cities. Converting 10% of street parking to bike lanes and charging for the remaining 90% often generates net revenue increases.
Carbon offset programs provide funding in climate-focused cities. Micromobility infrastructure reduces car trips, creating measurable emissions reductions that qualify for various funding programs.
Local business improvement districts often contribute because micromobility brings customers. Studies show retail areas with bike infrastructure see 40% higher foot traffic.
Measuring success and making adjustments
You can’t improve what you don’t measure. Set clear metrics before construction starts.
Track these key indicators:
- Daily ridership numbers across the network
- Accident rates per 100,000 trips
- Average trip distance and duration
- User demographics and equity of access
- Modal shift from cars to micromobility
- Economic impact on adjacent businesses
Survey users quarterly. Ask what works, what doesn’t, and what would make them ride more often.
Compare your data to similar cities. National benchmarks help identify whether your numbers reflect good planning or room for improvement.
Adjust based on evidence, not complaints. Loud opponents often represent a small minority. Look at actual usage data.
Seasonal variations matter. Don’t judge winter performance against summer ridership. Compare year-over-year instead.
Making your streets work for everyone who uses them
Cities that succeed with micromobility infrastructure don’t just add bike lanes. They rethink how street space serves people instead of just cars.
The planning process takes time, patience, and willingness to adapt. But the payoff includes reduced traffic congestion, cleaner air, healthier residents, and more vibrant public spaces.
Start with one well-designed corridor. Prove the concept works. Then expand based on what you learn. Perfect planning that never gets built helps nobody. Good planning that launches this year and improves over time changes cities for the better.
Your community deserves infrastructure that makes sustainable transportation the easy choice, not the hard one. Build that, and adoption takes care of itself.