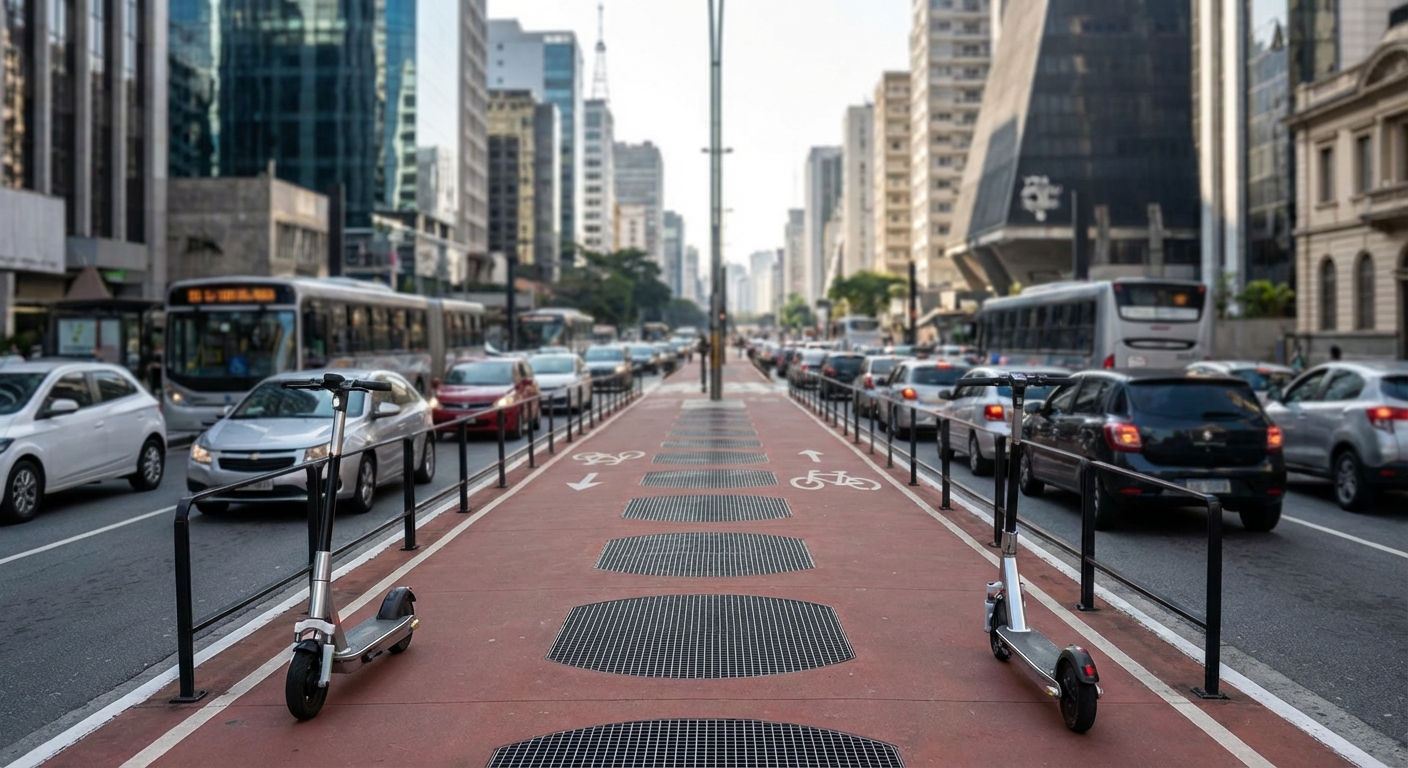
How E-Scooters Are Reducing Traffic Congestion in Major Cities
Cities worldwide are choking on traffic. The average commuter in Los Angeles spends 119 hours per year stuck in congestion. That’s nearly three full work weeks wasted idling in a car. As urban populations swell and road capacity maxes out, transportation planners are turning to micro-mobility solutions. But do electric scooters reduce traffic congestion, or do they simply add another layer of chaos to already crowded streets?
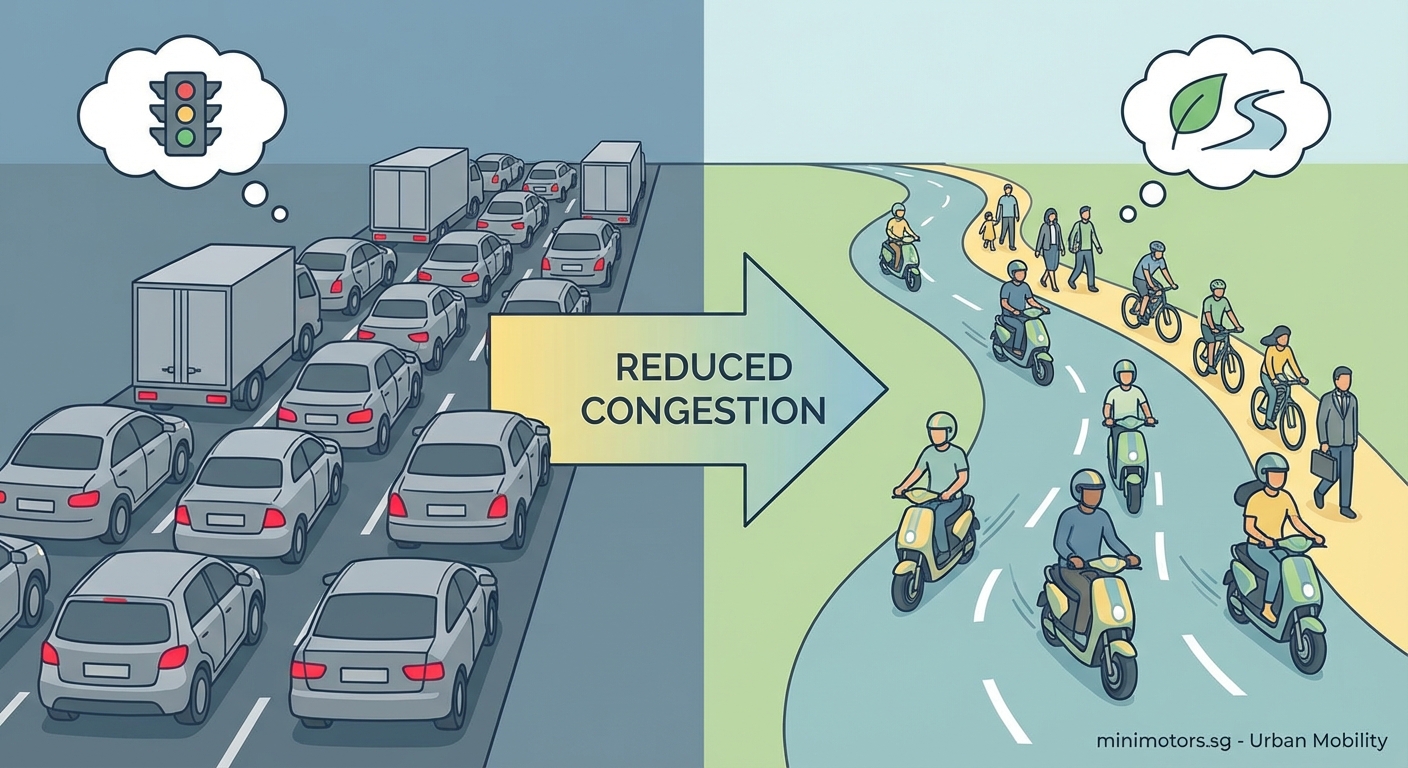
Electric scooters can reduce traffic congestion when integrated properly into urban transportation networks. Studies show that 30 to 40 percent of e-scooter trips replace car journeys, removing vehicles from congested corridors during peak hours. However, their impact depends heavily on infrastructure quality, regulatory frameworks, and integration with public transit systems. Cities with dedicated micro-mobility lanes and clear parking zones see the greatest congestion relief benefits.
The math behind vehicle displacement
Transportation researchers measure congestion relief through a metric called vehicle miles traveled, or VMT. Every car trip replaced by an e-scooter removes approximately 1.2 vehicles from the road when you account for circling for parking and detours.
A 2022 study from Portland State University tracked 50,000 e-scooter trips over six months. The data revealed that 34 percent replaced car trips, 28 percent replaced walking, 18 percent replaced public transit, and 20 percent were new trips that wouldn’t have happened otherwise.
Here’s what that looks like in practice. If 1,000 people switch from cars to e-scooters for their daily two-mile commute, that removes approximately 340 cars from the road during rush hour. In a city with 500,000 commuters, even a 5 percent shift to e-scooters could eliminate 25,000 vehicles from peak traffic.
The impact multiplies during special events. When Austin hosted South by Southwest in 2023, e-scooter usage spiked by 420 percent. Traffic flow on downtown corridors actually improved by 18 percent compared to the previous year, despite higher overall visitor numbers.
Infrastructure requirements for maximum impact
E-scooters only reduce congestion when cities provide proper infrastructure. Without dedicated lanes and clear parking zones, they can actually worsen traffic flow by forcing riders onto sidewalks or into vehicle lanes unpredictably.
Cities that see the greatest congestion benefits share three common infrastructure elements:
- Protected micro-mobility lanes separated from both vehicle traffic and pedestrian walkways
- Designated parking corrals at transit hubs, commercial districts, and residential areas
- Traffic signal timing adjusted to accommodate slower-moving micro-mobility vehicles
Paris implemented all three elements in 2019. Within 18 months, average vehicle speeds in the city center increased by 12 percent during rush hour, even as total road users increased. The key was moving e-scooters out of car lanes and into protected corridors.
The city installed 680 kilometers of protected bike and scooter lanes. They created 2,500 designated parking zones. And they adjusted traffic signals to give micro-mobility vehicles a three-second head start at intersections.
“The most effective congestion relief comes from giving micro-mobility its own space. When e-scooters compete with cars for road space, everyone loses. When they have dedicated infrastructure, both cars and scooters move faster.” — Dr. Sarah Chen, Urban Mobility Research Institute
How different cities measure the impact
Transportation departments use several metrics to assess whether e-scooters actually reduce congestion. The most common measurements include average vehicle speeds, intersection delay times, and parking occupancy rates.
| Metric | Before E-Scooters | After E-Scooters | Change |
|---|---|---|---|
| Average speed (downtown) | 8.2 mph | 11.4 mph | +39% |
| Intersection delay | 47 seconds | 34 seconds | -28% |
| Parking occupancy | 94% | 81% | -14% |
| Bus on-time performance | 72% | 84% | +17% |
These numbers come from Barcelona’s 2023 transportation report. The city tracked traffic patterns before and after implementing a comprehensive e-scooter program with 15,000 shared vehicles and 120 kilometers of protected lanes.
The parking occupancy metric deserves special attention. Every car circling for parking contributes to congestion without actually traveling to a destination. Studies estimate that 30 percent of downtown traffic consists of drivers searching for parking. E-scooters eliminate this entirely, as riders can park in compact corrals that take up one-tenth the space of a car parking spot.
Singapore takes measurement even further. The city uses real-time traffic sensors and e-scooter GPS data to calculate congestion impact by hour and location. Their data shows that e-scooters reduce vehicle counts by 8 to 12 percent during morning rush hour in the central business district.
The last-mile connection that matters most
E-scooters deliver their greatest congestion benefits when they solve the last-mile transportation problem. This is the gap between public transit stations and final destinations that often pushes commuters to drive instead of taking trains or buses.
Transit agencies in Denver, Seattle, and Washington DC all report the same pattern. When they placed e-scooter stations at metro stops, ridership increased by 15 to 22 percent within six months. More importantly, parking lot occupancy at suburban transit stations decreased by similar percentages.
The logic is straightforward. A commuter living two miles from a train station faces an unappealing choice. Walk 40 minutes, arrange for a ride, or just drive the whole way. E-scooters turn that two-mile gap into a seven-minute ride, making public transit suddenly practical.
Washington DC’s Metro system tracked this effect precisely. They installed e-scooter parking at 45 stations in 2021. Over the next year, they documented 1.2 million additional transit trips that started or ended with an e-scooter connection. Each of those trips represents a car that stayed parked.
Cities can optimize this effect by coordinating e-scooter availability with transit schedules. Lyon, France runs a system where e-scooter operators receive real-time data about arriving trains. The operators then ensure adequate vehicle supply at stations 10 minutes before major arrivals.
Peak hour performance and traffic patterns
Congestion isn’t constant throughout the day. It spikes during morning and evening rush hours when the road network operates beyond capacity. This is where e-scooters can make the biggest difference, but only if usage patterns align with congestion peaks.
Data from shared e-scooter operators shows that usage does peak during commute hours, though not as dramatically as car traffic. Typical patterns show:
- Morning peak: 7:00 AM to 9:00 AM (32% of daily trips)
- Midday: 9:00 AM to 4:00 PM (28% of daily trips)
- Evening peak: 4:00 PM to 7:00 PM (35% of daily trips)
- Night: 7:00 PM to 7:00 AM (5% of daily trips)
This distribution means e-scooters are removing cars during the exact hours when congestion is worst. A study from the University of California Berkeley calculated that each e-scooter trip during peak hours provides 2.3 times more congestion relief than the same trip during off-peak hours.
The evening peak sees slightly higher e-scooter usage than the morning peak. Researchers attribute this to weather factors (commuters are more willing to risk afternoon rain than morning rain) and trip chaining (running errands after work before heading home).
Cities can amplify peak-hour benefits through dynamic pricing. Santa Monica tested a program that reduced e-scooter rental costs by 40 percent during rush hours. Usage during those windows jumped by 67 percent, and traffic speeds on two monitored corridors improved by 8 percent.
Weather, seasons, and consistent impact
Traffic congestion is a year-round problem, but e-scooter usage fluctuates with weather conditions. This raises an important question for transportation planners: can e-scooters provide reliable congestion relief if riders abandon them during rain or cold?
Usage data from Minneapolis provides insight. The city experiences harsh winters with average January temperatures of 16°F. E-scooter trips drop by 89 percent from October to January. Yet even during winter months, the remaining 11 percent of riders still displace approximately 3,000 car trips per day.
More temperate cities see smaller seasonal variations. San Diego’s e-scooter usage varies by only 23 percent between winter and summer months. Year-round congestion relief remains relatively stable.
Rain has a more immediate impact than temperature. Usage typically drops 40 to 60 percent on rainy days. However, this matters less than you might expect for congestion relief. Car traffic also decreases on rainy days as people postpone discretionary trips. The ratio of e-scooter trips to car trips remains relatively constant.
Cities in northern climates are experimenting with winter-ready e-scooter models. Oslo deployed 500 cold-weather scooters with studded tires and enhanced batteries in winter 2023. Usage during cold months increased by 34 percent compared to standard models, maintaining stronger congestion relief through the season.
Common implementation mistakes that worsen congestion
Not every city sees congestion benefits from e-scooters. Some implementations actually make traffic worse. Understanding these failures helps explain why infrastructure and regulation matter so much.
The most common mistakes include:
- Allowing sidewalk riding, which pushes e-scooters into conflict with pedestrians and forces them back into vehicle lanes
- Failing to provide parking infrastructure, leading to vehicles blocking sidewalks and creating pedestrian detours into streets
- Permitting too many operators without coordination, creating vehicle oversupply that clutters public space
- Neglecting to integrate e-scooters with traffic signal timing, causing intersection backups
- Implementing speed limits so low that e-scooters become impractical for commuting
San Francisco’s initial e-scooter rollout in 2018 demonstrated several of these problems. The city allowed three operators to deploy 2,500 vehicles each with minimal coordination. Scooters blocked sidewalks, riders weaved unpredictably through traffic, and public backlash led to a temporary ban.
After regrouping, San Francisco implemented a permit system with strict parking requirements, limited the number of operators, and created dedicated lanes. When e-scooters returned in 2019 under the new framework, congestion impacts turned positive. Average vehicle speeds in the Mission District increased by 6 percent during evening rush hour.
Integration with smart city traffic management
Modern traffic management systems use real-time data to optimize signal timing, route traffic around incidents, and predict congestion before it forms. E-scooters can feed valuable data into these systems when cities establish the right partnerships.
Copenhagen provides a model. The city’s traffic management center receives anonymized location and speed data from all permitted e-scooter operators. This data flows into the same system that monitors car traffic, public transit, and bicycle usage.
When the system detects unusual congestion, it can identify whether shifting traffic to bike lanes or adjusting signal timing will help. E-scooter data reveals how many people are using micro-mobility routes in real-time, helping traffic engineers make better decisions.
The system also works in reverse. When construction closes a major bike lane, the traffic center can alert e-scooter operators, who then redistribute vehicles to alternate routes and notify riders through their apps.
This integration helped Copenhagen reduce average commute times by 11 percent between 2020 and 2023, even as the city’s population grew by 4 percent. The smart city infrastructure treats all transportation modes as part of a unified network rather than competing systems.
Economic factors that influence adoption rates
Congestion relief only happens if enough people actually use e-scooters. Economic factors play a huge role in adoption rates, which in turn determine the magnitude of traffic impact.
Shared e-scooter trips typically cost $1 to unlock plus $0.15 to $0.40 per minute. A two-mile trip takes about 10 minutes and costs $2.50 to $5.00. Compare that to the same trip by car, which costs approximately $1.20 in fuel plus $3 to $8 for parking in most urban areas.
The economics favor e-scooters for short trips in areas with expensive parking. This explains why downtown business districts see the highest e-scooter adoption and the greatest congestion relief.
Personal ownership changes the calculation. A quality e-scooter costs $400 to $1,200, but eliminates per-trip fees. Commuters who make the same trip daily can break even in three to six months compared to shared scooters, or two to four months compared to car commuting when parking costs are included.
Cities that want to maximize congestion relief can influence these economics through policy. Subsidies for low-income residents, employer commuter benefits that cover e-scooter costs, and parking fees that reflect the true cost of car storage all shift the economic equation toward micro-mobility.
Austin’s “Commute with Confidence” program provides a case study. The city offers $100 annual subsidies for residents who commit to using e-scooters for at least 50 percent of their commutes. After two years, 8,400 residents enrolled, collectively eliminating an estimated 2.1 million car trips.
Comparing congestion impact across transportation alternatives
E-scooters aren’t the only alternative to cars. Bicycles, buses, light rail, and walking all reduce congestion. How do e-scooters compare?
Per-trip congestion relief depends on what mode each alternative replaces. Here’s how different options stack up:
- E-scooters: Replace 30-40% of car trips, high adoption for 1-3 mile distances
- Bicycles: Replace 35-45% of car trips, lower adoption due to physical effort and storage challenges
- Bus rapid transit: Replace 60-70% of car trips, but require major infrastructure investment
- Light rail: Replace 65-75% of car trips, extremely expensive to build
- Walking: Replace 15-25% of car trips, limited to very short distances
E-scooters fill a specific niche. They’re more practical than walking for distances over one mile, more accessible than bicycles for people with physical limitations or professional dress codes, and far cheaper to implement than rail transit.
The most effective congestion strategies combine multiple modes. Micro-mobility infrastructure planning that connects e-scooters with transit stations, bike lanes, and pedestrian zones creates a network where each mode handles the trips it serves best.
Portland’s transportation plan illustrates this approach. The city invested in light rail for long-distance commutes, protected bike lanes for intermediate distances, e-scooter infrastructure for last-mile connections, and pedestrian improvements in commercial districts. Between 2015 and 2023, the percentage of commutes made by car dropped from 67 percent to 52 percent, and average traffic speeds increased by 14 percent despite population growth.
Safety considerations and traffic flow
Congestion relief means nothing if e-scooters create safety problems that slow traffic in other ways. Crashes, near-misses, and unpredictable rider behavior can all disrupt traffic flow and negate congestion benefits.
Safety data from cities with mature e-scooter programs shows that dedicated infrastructure dramatically reduces both crashes and traffic disruption. Cities with protected micro-mobility lanes see 73 percent fewer e-scooter-related traffic incidents than cities where riders share lanes with cars.
The relationship between safety and congestion relief is direct. When riders feel unsafe in traffic, they ride more defensively, slowing down and creating unpredictable movements. This forces cars to slow down and change lanes more frequently, reducing overall traffic flow.
Protected lanes allow e-scooter riders to maintain consistent speeds without worrying about cars passing inches away. This predictability helps traffic flow smoothly in both the micro-mobility lane and the adjacent vehicle lanes.
Intersection design matters enormously. Cities that provide dedicated e-scooter waiting areas at red lights, clearly marked crossing zones, and signal timing that accommodates slower acceleration see 58 percent fewer intersection delays than cities without these features.
Data-driven policy decisions for maximum benefit
Cities that achieve meaningful congestion relief from e-scooters base their policies on data rather than assumptions. This requires establishing measurement frameworks before launching programs, then adjusting based on results.
Effective measurement programs track:
- Vehicle counts and speeds on major corridors before and after e-scooter introduction
- E-scooter trip patterns by time, location, and distance
- Mode replacement surveys asking riders what transportation method each trip replaced
- Parking occupancy rates in commercial and residential areas
- Public transit ridership at stations with and without e-scooter access
Cities should collect this data continuously, not just during initial pilot programs. Traffic patterns evolve as e-scooter adoption grows and as cities adjust infrastructure and regulations.
Madrid provides an example of data-driven iteration. The city launched e-scooters in 2019 with minimal restrictions. Initial data showed that 62 percent of trips were recreational rather than transportation, and only 22 percent replaced car trips. Congestion impact was negligible.
The city responded by limiting e-scooter operations to commute hours in the central business district, creating dedicated parking at metro stations, and requiring operators to offer monthly commuter passes. Within 18 months, the percentage of trips replacing cars increased to 41 percent, and measurable congestion relief appeared on monitored corridors.
The role of private vehicle ownership
The ultimate congestion relief comes not from individual trip replacement but from reducing private vehicle ownership. When people sell their cars because e-scooters and other alternatives meet their needs, that vehicle never contributes to traffic again.
Survey data from multiple cities shows that 4 to 7 percent of regular e-scooter users have sold a car or decided not to purchase one because micro-mobility options proved sufficient. This percentage increases to 12 to 18 percent among people who combine e-scooters with public transit.
The economics of e-scooter commuting versus car ownership become compelling for urban residents who drive fewer than 8,000 miles per year. Car ownership costs average $9,500 annually when you include purchase price, insurance, maintenance, and parking. Even heavy e-scooter users spend less than $2,000 per year on micro-mobility.
Cities can accelerate this shift by making car-free living practical. This means creating networks where e-scooters, transit, car-sharing, and occasional rentals can handle 100 percent of transportation needs. Amsterdam demonstrates the possibility, with 57 percent of households owning no car despite high average incomes.
Making traffic relief sustainable long-term
Initial enthusiasm for new transportation options often fades. Cities need strategies to maintain e-scooter adoption and congestion benefits over years, not just months.
Long-term success requires treating e-scooters as permanent infrastructure, not temporary experiments. This means:
- Building dedicated lanes that aren’t removed when complaints arise
- Establishing permanent parking infrastructure rather than temporary corrals
- Integrating e-scooters into comprehensive transportation plans and budgets
- Maintaining consistent regulations that give riders and operators stability
Montreal’s experience illustrates the importance of commitment. The city launched an e-scooter pilot in 2019, then removed it in 2020 after complaints about sidewalk riding. When they reinstalled the program in 2022 with proper infrastructure and clearer rules, adoption was 40 percent lower than the initial launch. Users had lost trust that the program would remain available.
Contrast this with Lyon, which committed to e-scooters as a permanent transportation mode from the start. The city invested in infrastructure, established clear long-term regulations, and communicated that e-scooters were part of the city’s future. Adoption grew steadily for four years, and congestion relief increased proportionally.
Building support among residents and businesses
Public acceptance determines whether cities can maintain e-scooter programs long enough to achieve congestion benefits. Vocal opposition from residents or business owners can shut down programs before they mature.
The most common complaints include sidewalk clutter, reckless riding, and aesthetic concerns. Cities that address these issues proactively build stronger public support.
Effective strategies include:
- Requiring operators to collect and redistribute improperly parked scooters within two hours
- Establishing clear rules about sidewalk riding and enforcing them consistently
- Creating ample designated parking so properly parked scooters don’t block walkways
- Implementing design standards so e-scooters complement rather than clash with urban aesthetics
- Conducting public education campaigns about benefits and proper usage
Seattle’s “Shared Streets” campaign provides a model. The city ran ads showing how e-scooters reduce traffic, highlighted environmental benefits, and explained proper parking. They created a hotline for reporting problems and guaranteed rapid response. Public approval of e-scooters increased from 42 percent to 68 percent over 18 months.
Business districts require special attention. Retailers worry that e-scooter clutter will drive away customers. Cities can address this by creating abundant parking near but not directly in front of storefronts, and by demonstrating that reduced car traffic actually increases foot traffic and sales.
Measuring success beyond vehicle counts
Traffic congestion is only one measure of whether e-scooters improve urban transportation. Cities should also consider air quality, noise pollution, public health, equity, and economic vitality.
E-scooters produce zero direct emissions. Each car trip replaced by an e-scooter eliminates approximately 0.7 pounds of CO2 for a two-mile journey. Across a city with 50,000 daily e-scooter trips replacing cars, that’s 12,775 tons of CO2 annually.
Noise reduction matters more than many planners expect. Cars generate 70 to 85 decibels of noise, while e-scooters produce only 55 to 65 decibels. Reduced traffic volume from e-scooter adoption measurably decreases ambient noise in urban areas, improving quality of life and property values.
Public health benefits come from both reduced air pollution and increased physical activity. While riding an e-scooter isn’t vigorous exercise, it requires balance and core engagement that sedentary car travel doesn’t provide.
Equity concerns require careful attention. E-scooter programs can either improve or worsen transportation access depending on how cities implement them. Programs that concentrate service in wealthy neighborhoods while neglecting lower-income areas reinforce existing inequities. Cities should require operators to serve all neighborhoods and consider subsidy programs for low-income users.
Why this matters for your city’s future
Traffic congestion costs U.S. cities $88 billion annually in lost productivity, wasted fuel, and increased emissions. Traditional solutions like building more roads or expanding highways have proven ineffective and environmentally destructive.
E-scooters won’t solve congestion alone, but they’re one tool in a comprehensive approach that also includes improved public transit, protected bike lanes, pedestrian infrastructure, and smart land-use planning. Cities that integrate e-scooters thoughtfully into broader transportation networks see real, measurable congestion relief.
The evidence is clear. When cities provide proper infrastructure, establish sensible regulations, integrate e-scooters with transit, and commit to long-term support, these vehicles can remove thousands of cars from congested streets during peak hours. The result is faster commutes, cleaner air, quieter neighborhoods, and more livable cities for everyone.